Data analysis with Python: An introduction to Pandas and Jupyter Notebooks
Data Manipulation and Visualization
Kevin Beswick
Nushrat Khan
Bret Davidson
Agenda
| Lecture | 30 mins |
| Technical Orientation | 10 mins |
| Hands-on exercise part 1 | 45 mins |
| Break | 10 mins |
| Lecture | 15 mins |
| Hands-on exercise part 2 | 60 mins |
| Q/A | 10 mins |
Topics of this section:
- Merging data
- Cleaning data
- Sorting data
- Transforming data
- Visualization
Combining data
There are 2 different ways of combining DataFrames in Pandas:
- Concatenate: For large datasets, data can be split into multiple files. We can use the concat() function to concatenate DataFrames with the same structure.
- Database-style Merge: High performance in-memory join operations can be done using the merge() function.
A refresher in database theory
- Merges in Pandas are like joins in relational databases
- Join 2 DataFrames on a unique key found in both datasets (foreign key in DB)
- First table in a merge is referred to as "left" table, and second is referred to as "right" table
Inner Join
Join 2 tables by taking only rows where "foreign key" exists in both tables

Left Table

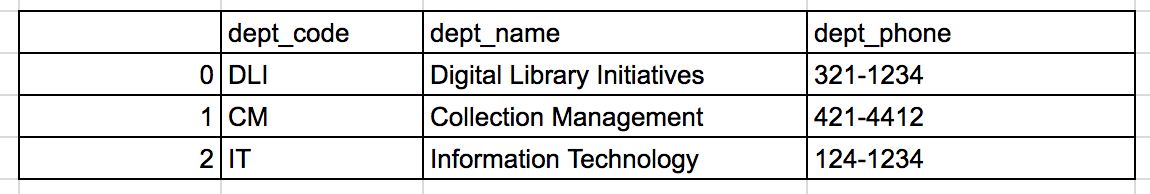
Right Table
Inner Join Example

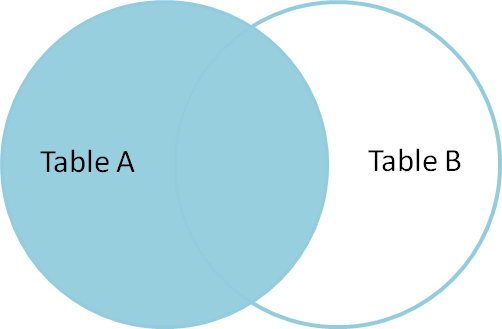
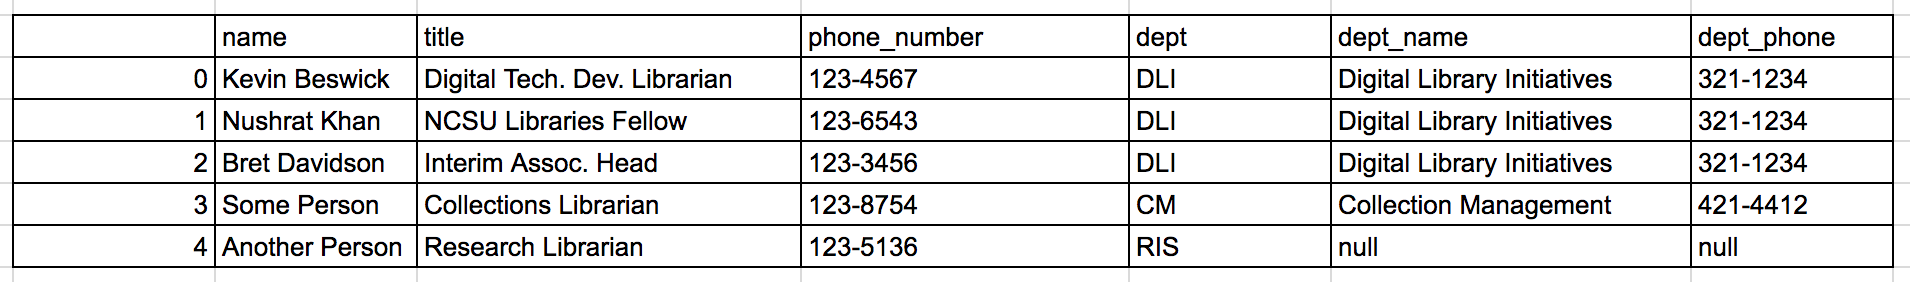
Left Join
Join 2 tables by taking all rows from left table, and leaving all row values in right table where "foreign key" doesn't exist as null
Left Table
Right Table
Left Join Example
Data Cleaning
Data cleaning is an important step before we can manipulate our data. We will show some examples of how to get rid of duplicate values, remove null values, special characters etc.
Sorting Data
Sorting makes it easier to read or locate any specific data. We can also group by particular variables to apply other functions to them.
Transforming Data
Pandas has functions to transform data formats, such as changing date format, converting data to a different unit. We can also define functions to perform a specific transformations over a row or column.
Visualization
After manipulating data, visualization is the final step that helps us communicate the meaning of the data with our audience. We will show examples of the following basic plot functions:
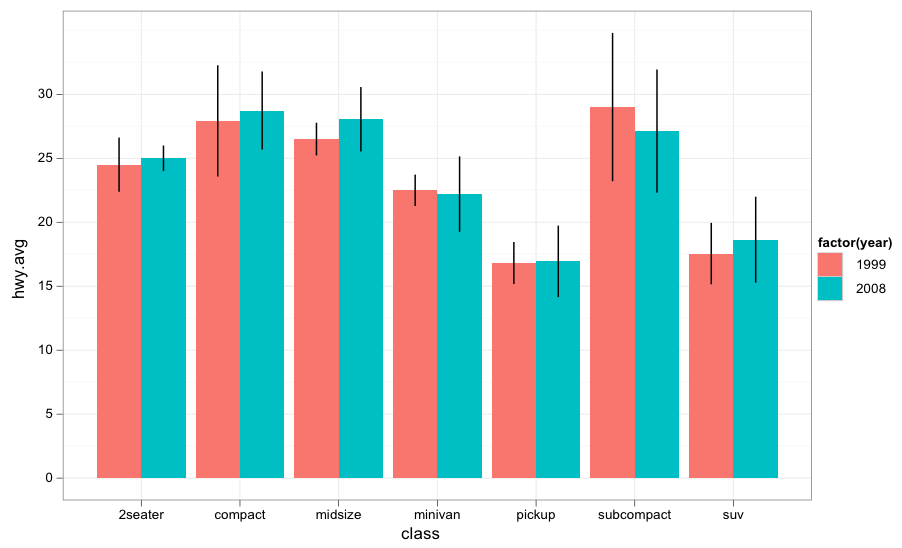
- Bar plot
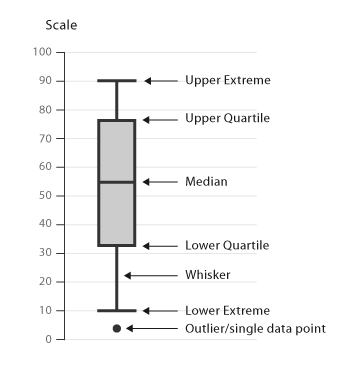
- Box plot
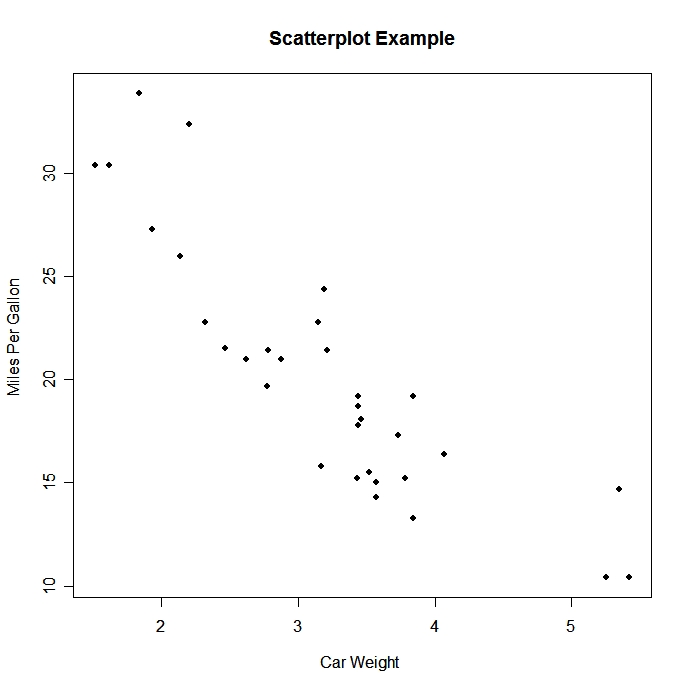
- Scatter plot
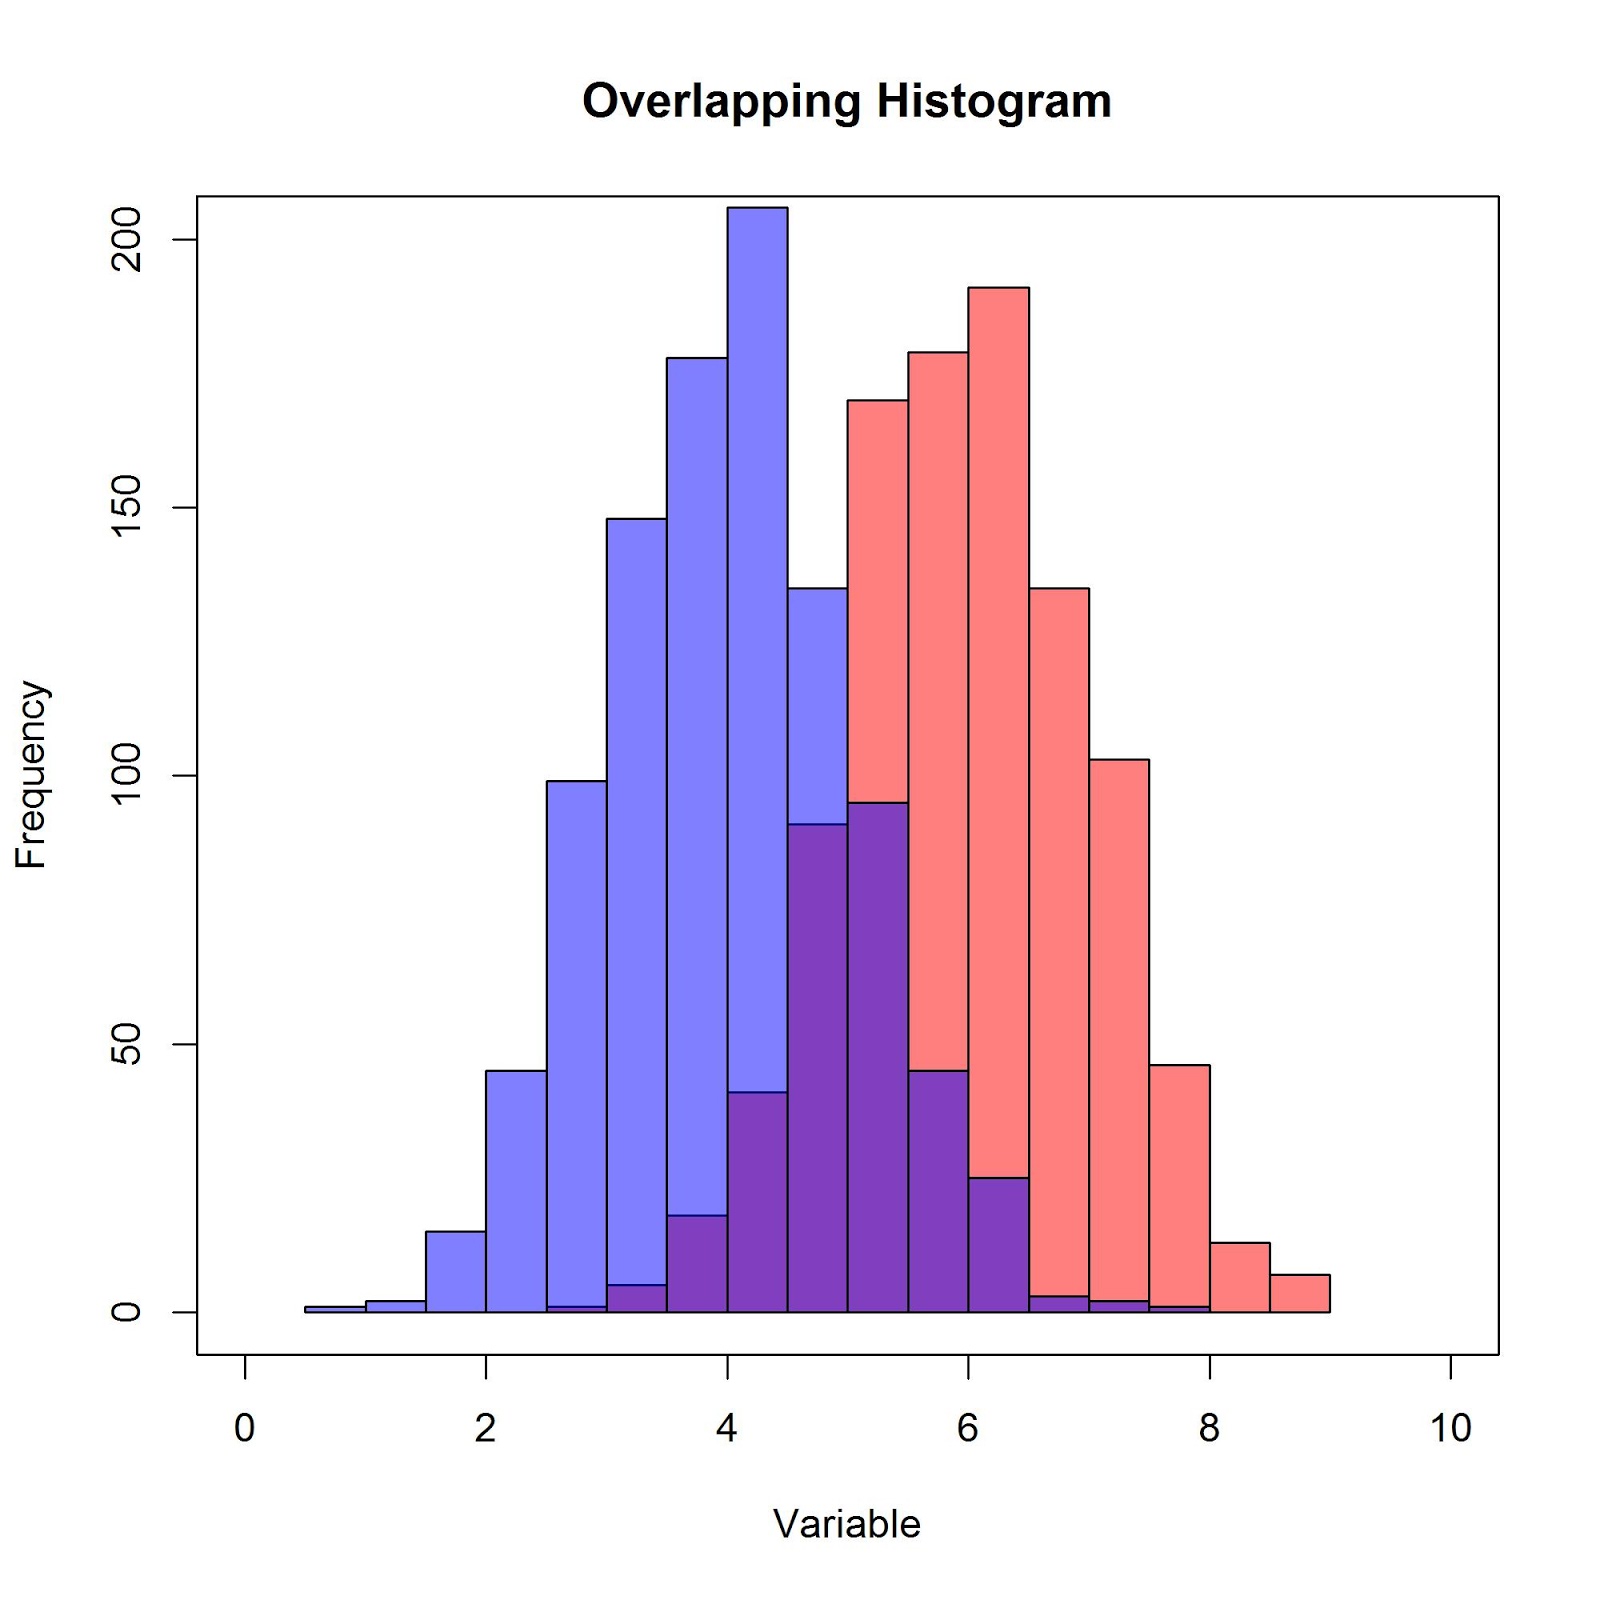
- Histogram
Bar plot
Box plot
Scatter plot
Histogram